How did Q7 Algo identify BDL during a flat NIFTY market?
Q7 Algo used its stock-selection and market-analysis approach to identify BDL while NIFTY remained relatively range-bound, first capturing a reported gain in BDL 1300 PE and later participating in a BDL futures move.
Table of Contents
- Chapter 1: How Q7 Algo Identified BDL Before the Big Move
- Chapter 2: When NIFTY Is Flat, Where Are the Opportunities?
- Chapter 3: The BDL Setup
- Chapter 4: First Opportunity: BDL 1300 PE
- Chapter 5: Why Stock Selection Mattersd
- Chapter 6: Why a Flat NIFTY Does Not Mean a Flat Market
- Chapter 7: The Role of AI and Data in Modern Trading
- Chapter 8: Q7 Trading Solutions and Algorithmic Trading
- Frequently Asked Questions (FAQs)
How Q7 Algo Identified BDL Before the Big Move
When the broader market refuses to move, trading can become frustrating. NIFTY can remain within a narrow range for hours while option premiums gradually lose value because of time decay and changing volatility. For traders who depend entirely on index direction, such sessions can become particularly challenging.
But a flat index does not necessarily mean every stock is flat. Individual stocks can develop their own momentum, create breakouts or reversals and move significantly even when the broader index remains range-bound. This is where stock selection can become an important part of an intraday trading strategy.
A recent BDL trading example shared by Q7 Trading Solutions demonstrates this concept. The story begins with BDL 1300 PE and later moves into BDL Futures. According to the supplied trading screenshots and Q7’s market commentary, the strategy first captured a reported gain in the BDL 1300 PE position and subsequently participated in a BDL Futures position as the underlying stock moved higher.
The important lesson from this example is not simply the final profit figure. It is the combination of stock selection, timing and execution.
When NIFTY Is Flat, Where Are the Opportunities?
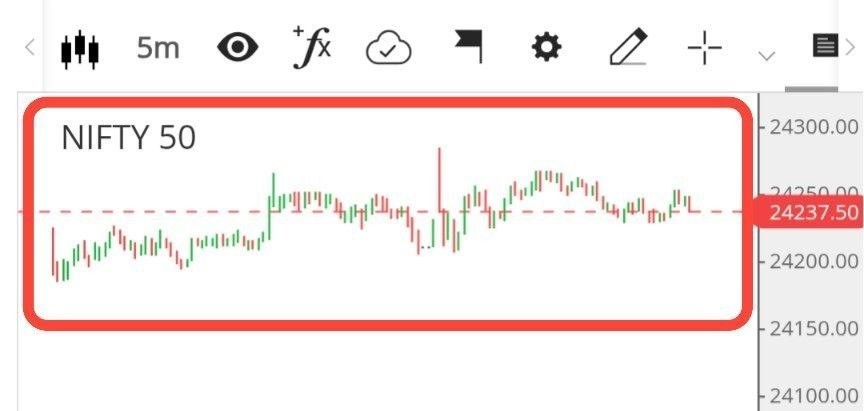
The market commentary supplied by Q7 describes a period when NIFTY remained around the same price for an extended period. For many options traders, this type of environment can be difficult because the index may not provide enough directional movement to generate attractive returns.
When the underlying index remains range-bound, option premiums can also come under pressure because of time decay and changes in volatility. This can leave traders frustrated as both call and put positions may struggle to perform.
However, a flat NIFTY does not mean that every stock in the market is standing still. Individual stocks can develop strong momentum independently of the index.
This creates a different question for traders. Instead of asking only, “Where is NIFTY going?”, a stock-selection strategy can also ask, “Which individual stock is showing a potential opportunity right now?”
That difference is at the heart of the BDL example.
The BDL Setup
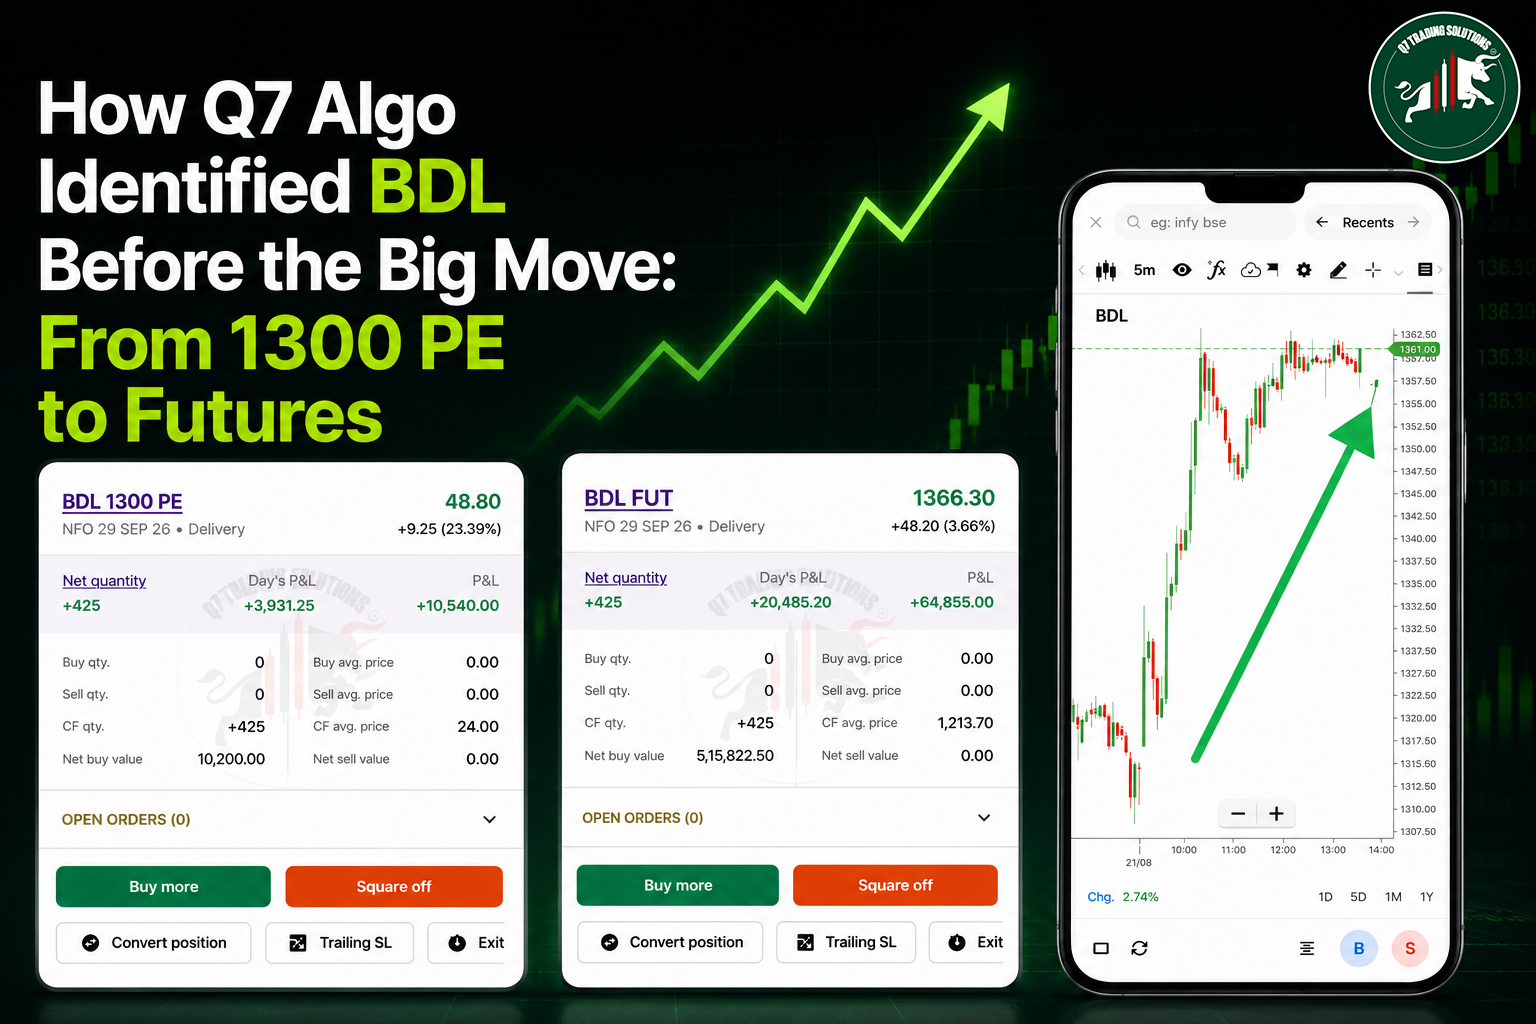
The supplied BDL 5-minute chart shows a significant upward movement from the lower price area, followed by consolidation near the higher levels. The chart displays BDL trading around ₹1,361, with a daily change of approximately 2.74%.
BDL 5-minute chart showing the stock’s upward price movement and subsequent consolidation.
The chart provides a visual representation of the stock’s movement highlighted in the Q7 commentary. While NIFTY was described as relatively inactive, BDL was demonstrating considerably stronger individual price action.
This is an important concept in stock-market trading. The performance of an individual company does not always move in exactly the same direction or at the same speed as the broader index
First Opportunity: BDL 1300 PE
The next part of the story involves BDL 1300 PE. The supplied trading screenshot shows a BDL 1300 PE position with a net quantity of 425. The screenshot displays a day’s P&L of ₹3,931.25 and an overall displayed P&L of ₹10,540. The displayed average price is ₹24, while the displayed price is ₹48.80.
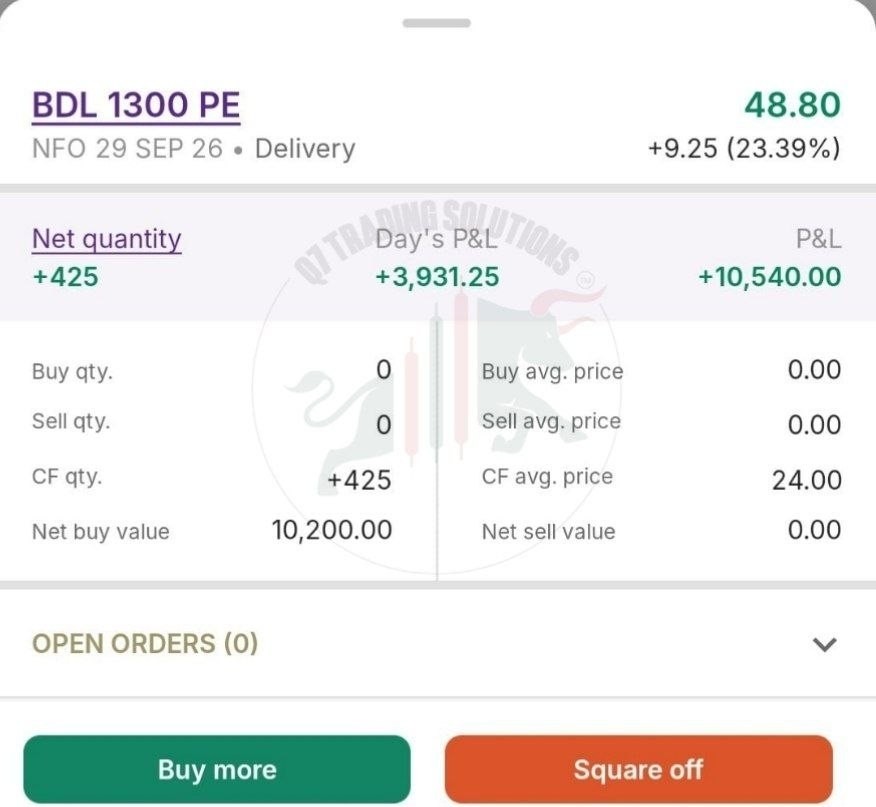
Supplied trading-account screenshot showing the BDL 1300 PE position with a displayed P&L of ₹10,540.
The displayed figures show a substantial movement in the option price from the average price shown on the screen. This is the first important part of the BDL case study.
The opportunity was not simply dependent on NIFTY making a large directional move. Instead, the focus was on an individual stock that was showing tradable price behaviour.
For traders, this highlights why stock selection can be important, particularly during sessions where the broader index is moving sideways.
From Put Option to Futures
The next stage of the Q7 example is the transition into BDL Futures. According to the supplied Q7 commentary, after the BDL 1300 PE opportunity, the strategy subsequently built a BDL Futures position.
The supplied futures screenshot shows BDL FUT with a net quantity of 425. The screenshot displays a day’s P&L of ₹20,485 and an overall P&L of ₹64,855. It also shows a carry-forward average price of ₹1,213.70 and a displayed BDL Futures price of ₹1,366.30.
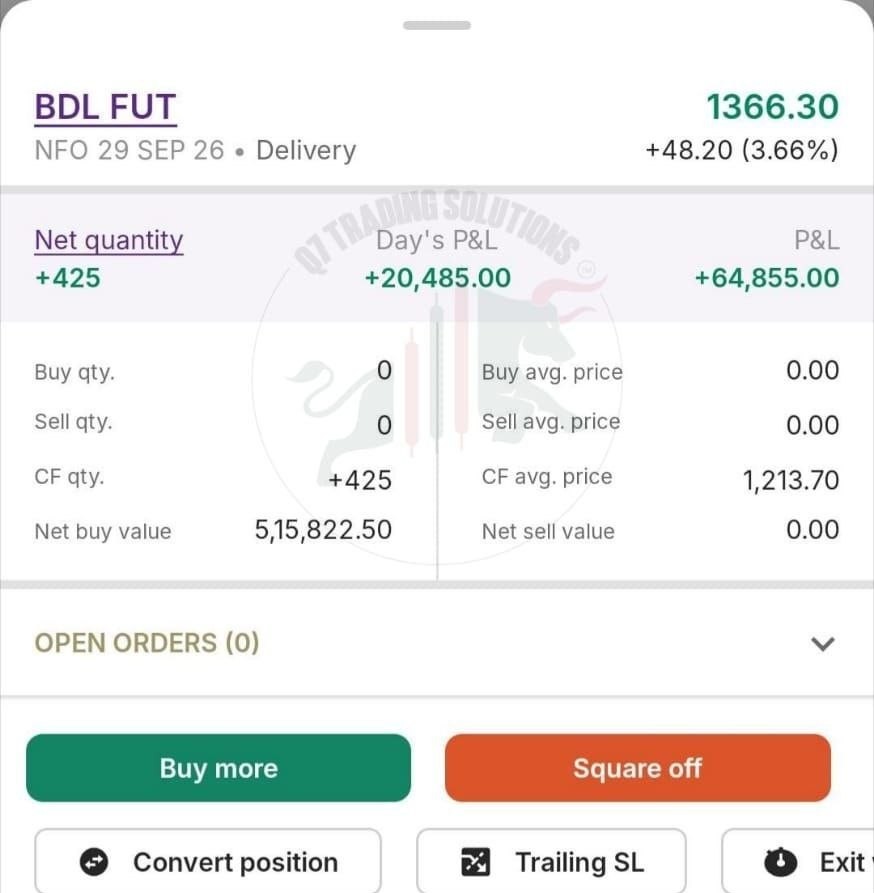
Supplied BDL Futures screenshot showing a displayed P&L of ₹64,855 for the reported position.
The ₹64,855 displayed P&L is the figure that Q7 refers to as approximately ₹65,000 profit in a single lot. It is important to understand that this is a specific historical position shown in the supplied screenshot and should not be interpreted as a guaranteed or repeatable daily return.
The interesting part of the example is the sequence. The strategy first identified an opportunity in BDL’s put option and subsequently participated through BDL Futures as the stock moved higher.
The ₹65,000 Single-Lot Example
The BDL Futures screenshot displays a P&L of ₹64,855, which is approximately ₹65,000. This is the strongest numerical result shown in the supplied screenshots.
However, the real significance of this example goes beyond the final number.
The sequence demonstrates how a trading strategy can potentially search for opportunities at the individual-stock level instead of relying entirely on the movement of NIFTY. While the broader market was described as flat, BDL displayed a much stronger move.
This is the type of market environment where stock selection can make a significant difference to an intraday strategy.
At the same time, traders should remember that a historical profit does not establish that the same strategy will produce the same result in future market conditions. Trading outcomes can vary because of entry price, exit price, position size, brokerage, taxes, slippage, volatility and liquidity.
Why Stock Selection Matters
The Indian stock market contains hundreds of actively traded securities. At any particular time, NIFTY can remain relatively quiet while individual stocks experience significant price movements.
This creates a major challenge for manual traders. Monitoring a large number of stocks continuously and identifying the strongest opportunities at the right time can be difficult.
An algorithmic trading system can be designed to scan multiple securities according to predefined conditions. Instead of manually checking charts one by one, the system can systematically evaluate market information and identify stocks that satisfy its trading criteria.
Depending on the methodology, those criteria may include price momentum, volume behaviour, volatility, trend structure, support and resistance, relative strength and other market variables.
The exact methodology of a proprietary algorithm is specific to its developer, but the underlying objective is straightforward: identify potential opportunities systematically rather than relying entirely on manual observation.
Why a Flat NIFTY Does Not Mean a Flat Market
One of the biggest lessons from the BDL example is that NIFTY is only an index. It represents a basket of companies, while individual stocks can behave very differently from the index.
Imagine a situation where NIFTY remains range-bound for several hours, volatility declines and index option premiums gradually erode. At the same time, one individual stock begins developing strong momentum.
A strategy that focuses exclusively on NIFTY may miss that opportunity.
A stock-selection strategy, on the other hand, can potentially identify the individual stock and analyse whether its price action meets the system’s predefined conditions.
That is why stock selection can be particularly valuable during sideways or choppy market conditions.
Manual Trading vs Algorithmic Trading
Manual traders have to continuously monitor the market, interpret charts, evaluate opportunities and make decisions under pressure. When markets move quickly, hesitation or emotional reactions can affect execution.
Algorithmic trading approaches these decisions differently. A computer system can process market information according to predefined rules and monitor multiple instruments simultaneously.
One potential advantage is speed. Another is consistency. The same trading rules can be applied repeatedly without changing because of fear, greed or excitement.
Automation can also reduce the need for constant manual intervention once the system has been properly configured.
However, algorithmic trading is not risk-free. An algorithm can also make losing trades, particularly when market conditions change or when a particular strategy enters a period of underperformance.
The Role of AI and Data in Modern Trading
Technology has changed the way financial markets can be analysed. Modern computing systems can process large amounts of information and monitor multiple securities simultaneously.
AI and algorithmic systems can be used to analyse patterns, identify potential setups and automate parts of the trading process. This can provide traders with a systematic framework for evaluating opportunities.
However, AI should not be considered a crystal ball. Markets remain uncertain, and unexpected events can change price behaviour very quickly.
A previously successful trading setup can fail. A strong trend can reverse. Liquidity can disappear. Volatility can increase suddenly.
Therefore, AI and algorithms should be viewed as tools for analysis and systematic execution rather than guarantees of profit.
What Makes the BDL Example Interesting?
The BDL example is particularly interesting because of the sequence presented in the supplied Q7 commentary.
The strategy first participated through BDL 1300 PE, where the supplied screenshot shows a displayed P&L of ₹10,540. The strategy then moved into BDL Futures, where the supplied screenshot shows a displayed P&L of ₹64,855.
The stock subsequently showed a strong upward move, with the supplied chart displaying approximately a 2.74% daily gain and the futures screenshot displaying a 3.66% daily change.
This sequence highlights three fundamental elements of algorithmic trading: selection, timing and execution.
Finding a strong stock too late can reduce the opportunity. Identifying a stock early without proper risk management can create unnecessary risk. And identifying the correct opportunity without executing consistently can make the analysis ineffective.
Does Q7 Algo Guarantee ₹65,000 Every Day?
No. The ₹64,855 figure shown in the BDL Futures screenshot represents the P&L displayed for that particular position.
It should be treated as a historical trading result and not as a promise of future performance.
Actual trading results can vary depending on the amount of capital used, position size, entry and exit prices, brokerage, taxes, slippage, market liquidity and overall market conditions.
Algorithmic trading does not eliminate market risk, and there is no reliable way to guarantee a particular profit from every trade.
Q7 Trading Solutions and Algorithmic Trading
Q7 Trading Solutions focuses on technology-driven and algorithmic approaches to market participation. The BDL example shared by Q7 demonstrates the type of opportunity that can emerge when individual-stock selection becomes the focus rather than relying solely on the direction of NIFTY.
The supplied screenshots tell a simple sequence: BDL 1300 PE opportunity, followed by a BDL Futures position and a displayed ₹64,855 P&L.
For traders considering algorithmic solutions, the important question should not simply be how much profit a particular screenshot shows. Traders should also understand the methodology, risk management, execution process and potential drawdowns associated with the strategy.
Final Thoughts
A sideways market can be one of the most challenging environments for traders. When NIFTY remains range-bound, index traders may struggle to find directional opportunities while option premiums can continue to lose value.
The BDL example shared by Q7 Trading Solutions demonstrates another way of looking at the market. Instead of focusing exclusively on NIFTY, the strategy identified an opportunity in an individual stock.
The supplied screenshots show a BDL 1300 PE position with a displayed P&L of ₹10,540 and a BDL Futures position with a displayed P&L of ₹64,855. The accompanying BDL chart also shows a strong upward movement in the stock.
The broader lesson is simple: the market may appear flat at the index level while significant opportunities can still develop in individual stocks.
Algorithmic systems can potentially help traders search for these opportunities systematically through stock selection, data analysis, timing and automated execution.
But every trade involves risk, and historical results should always be viewed as historical results rather than promises of future income.
Q7 Algo: Using data, technology and systematic stock selection to identify potential opportunities in the market.
Historical performance can demonstrate what happened in the past, but it cannot guarantee what will happen in the future.
Frequently Asked Questions (FAQs)
According to the supplied Q7 commentary, the algorithm identified BDL as an individual-stock opportunity while NIFTY remained relatively range-bound. The strategy first participated through BDL 1300 PE and later through BDL Futures.
The supplied BDL Futures screenshot displays a P&L of ₹64,855 and a day’s P&L of ₹20,485 for the displayed position.
The supplied BDL 1300 PE screenshot displays a P&L of ₹10,540 and a day’s P&L of ₹3,931.25.
The supplied BDL chart displays the stock around ₹1,361 and shows a daily change of approximately 2.74% on the chart. The accompanying futures screenshot displays BDL at ₹1,366.30 with a daily change of 3.66%.
Algorithmic trading systems can be designed to scan individual stocks and identify conditions that meet predefined trading rules even when a broader index is range-bound. However, identifying an opportunity does not guarantee a profitable trade.
No. The ₹64,855 figure is the P&L displayed in the supplied BDL Futures screenshot for that particular position. It is a historical result and does not guarantee the same outcome on future trades.
Individual stocks can move significantly even when a broad index is relatively flat. Stock-selection systems attempt to identify securities displaying conditions that may create trading opportunities.
No. Algorithmic trading carries market risk and can generate losses. Automated execution does not remove risks associated with volatility, liquidity, strategy performance, slippage or unexpected market events.