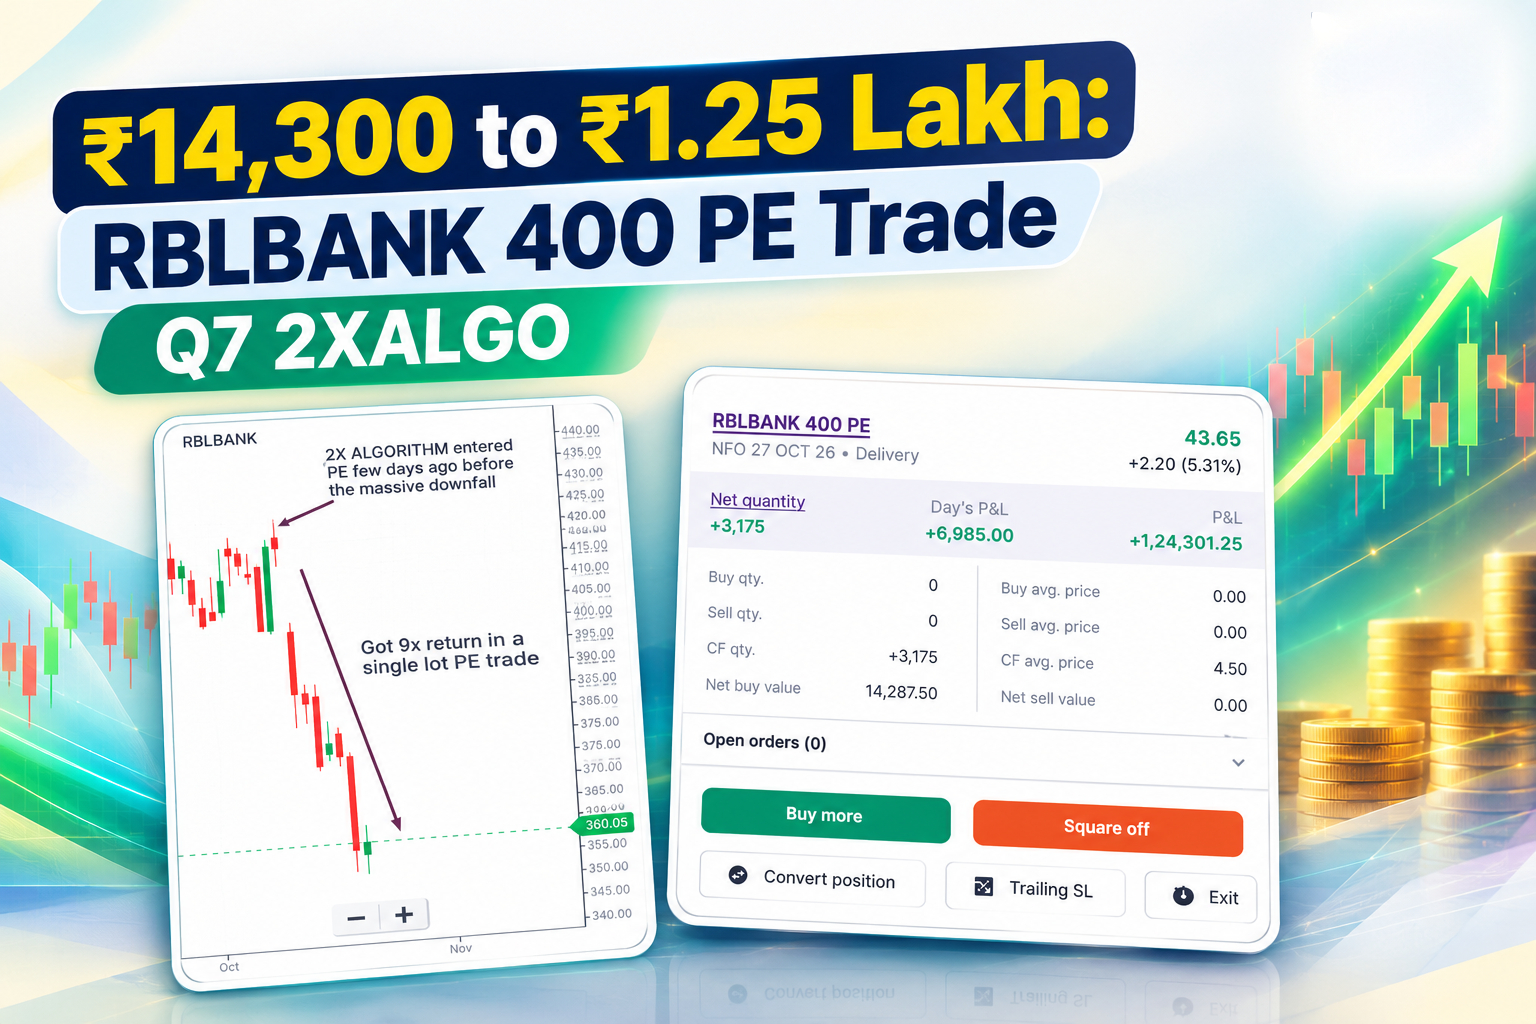
What was the reported result of the RBLBANK 400 PE trade?
According to the performance details supplied by Q7 Trading Solutions, the RBLBANK 400 PE position was entered at an average price of ₹4.50 and later showed a price of ₹43.65. The supplied screenshot displays a profit and loss figure of ₹1,24,301.25, while the accompanying promotional content rounds the result to approximately ₹1.25 lakh from an initial investment of around ₹14,300.
Table of Contents
- Chapter 1: Introduction: A Trade During a Sharp Market Move
- Chapter 2: RBLBANK 400 PE: Understanding the Trade
- Chapter 3: Q7 2XALGO and Algorithmic Trading
- Chapter 4: Why Entry Timing Matters in an Options Trade
- Chapter 5: Reviewing the Reported Profit and Loss
- Chapter 6: Automation Does Not Remove Risk
- Frequently Asked Questions (FAQs)
Introduction: A Trade During a Sharp Market Move
Market volatility can create opportunities in options trading, but identifying a potential move and acting on it are two different challenges. The RBLBANK 400 PE trade highlighted by Q7 Trading Solutions illustrates how a position in a put option can increase substantially in value when the underlying stock moves sharply in the anticipated direction.
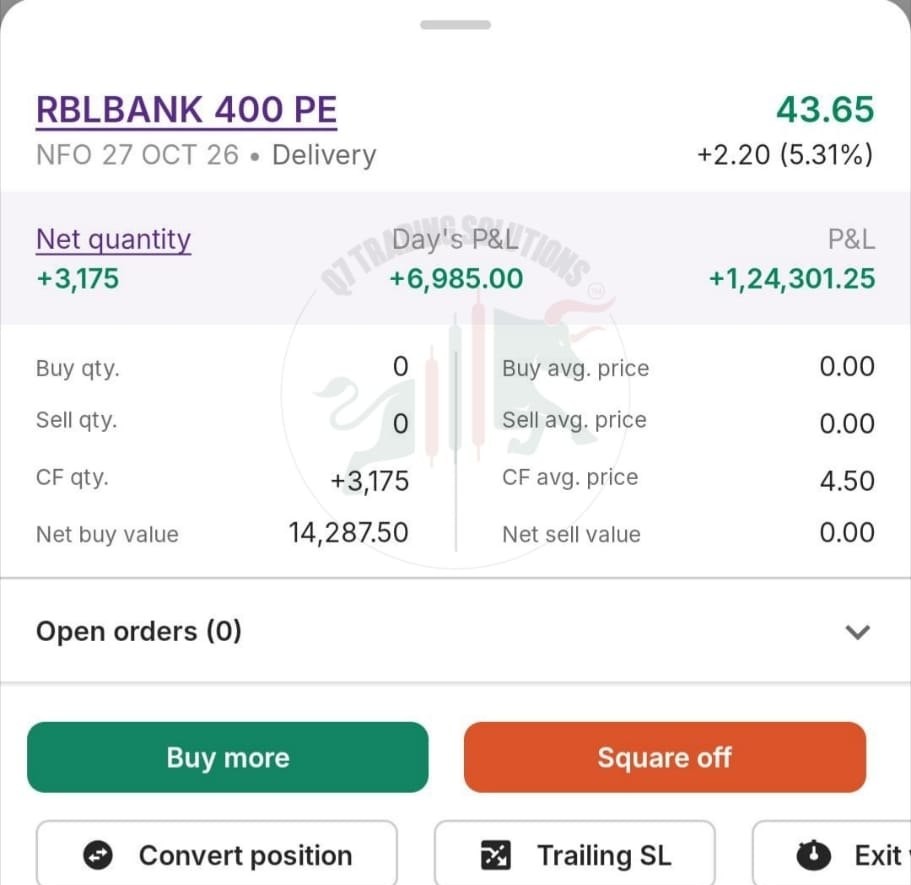
The supplied trade material highlights an entry at ₹4.50 and a displayed current price of ₹43.65. Alongside these figures, the position screenshot shows a net quantity of 3,175 and a displayed profit and loss of ₹1,24,301.25. Q7’s accompanying promotional material describes the result as approximately ₹1.25 lakh in profit against capital of around ₹14,300.
The example is presented in connection with Q7’s 2XALGO algorithmic trading offering. The following sections explain the supplied trade figures, the role attributed to the algorithm and the information visible in the screenshots.
RBLBANK 400 PE: Understanding the Trade
The highlighted instrument is RBLBANK 400 PE, with the contract details shown in the supplied screenshot as NFO 27 OCT 26 and Delivery. The performance material identifies an average entry price of ₹4.50 and a displayed price of ₹43.65.
The second supplied image shows a sharp downward movement in the RBLBANK chart. Its annotation states that the 2X algorithm entered the put option a few days before the major decline. The chart is intended to illustrate the timing of the position in relation to the subsequent market move.
A put option can gain value when the underlying stock declines, although the result depends on factors such as the option’s price, contract characteristics, timing and other market conditions. The screenshot provides an example of the reported position; it does not establish that similar results will occur in future trades.
Trade Performance at a Glance
| Trade detail | Supplied figure |
|---|---|
| Instrument | RBLBANK 400 PE |
| Contract details displayed | NFO 27 OCT 26 |
| Average entry price | ₹4.50 |
| Displayed current price | ₹43.65 |
| Net quantity shown | 3,175 |
| Net buy value shown | ₹14,287.50 |
| Displayed P&L | ₹1,24,301.25> |
| Rounded profit highlighted in promotional material | Approximately ₹1,25,000 |
| Approximate initial capital highlighted | ₹14,300 |
These figures are transcribed from the supplied screenshots and promotional text. The exact displayed P&L is ₹1,24,301.25, while ₹1.25 lakh is the rounded figure used in the accompanying promotional material.
How the RBLBANK Chart Illustrates the Move
The supplied chart shows RBLBANK trading around the ₹400–₹420 area before a series of sharp downward candles. The annotation marks the earlier entry in the put option and points towards the subsequent decline, with the chart displaying a level near ₹360.05.
The purpose of this screenshot is to show the market movement associated with the trade example. It visually connects the annotated entry with the subsequent fall in the underlying stock. However, the chart alone does not provide a complete record of every execution, the option’s full price history or all costs associated with the position.
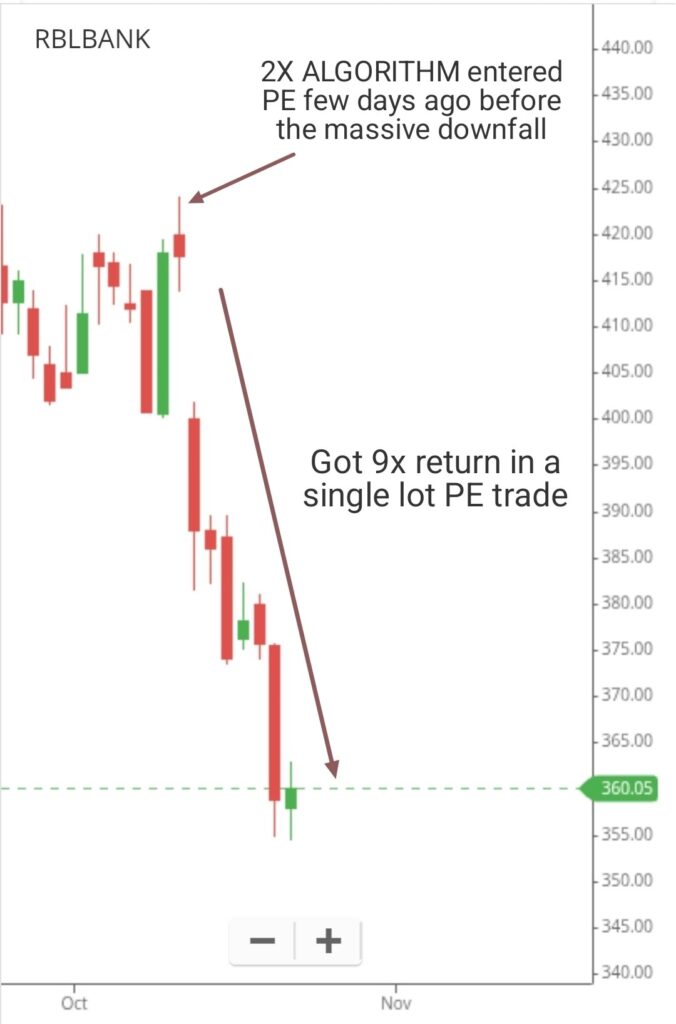
The chart illustrates the underlying market move, while the position screenshot displays the option’s average price, quantity and P&L.
Q7 2XALGO and Algorithmic Trading
Q7 Trading Solutions presents 2XALGO as an algorithmic trading tool intended to operate in both Call Option (CE) and Put Option (PE) opportunities, depending on market conditions. In the supplied RBLBANK example, the highlighted position is a PE trade.
The accompanying material attributes the result to the algorithm’s entry ahead of the sharp decline. It also describes the approach in terms of identifying potential pre-breakout or pre-breakdown levels, stock selection and execution. These are descriptions of the product’s intended approach in the supplied promotional material, rather than independently verified measures of the algorithm’s overall performance.
Algorithmic trading uses programmed rules to identify conditions and carry out trading actions. Automation can help implement a defined process, but it does not eliminate market risk. Results can vary with market conditions, execution prices, liquidity, transaction costs and the rules used by a trading system.
Why Entry Timing Matters in an Options Trade
The supplied RBLBANK chart draws attention to the timing of the put-option entry before the pronounced decline. In options trading, entry price can have a major effect on the eventual percentage return because the position’s value may change rapidly as the underlying market moves.
In this example, the supplied entry figure is ₹4.50, compared with a displayed price of ₹43.65. The difference between these two quoted prices is central to the performance story presented by Q7. Nevertheless, a price movement of this size is specific to the illustrated trade and should not be treated as a typical or expected outcome.
A disciplined trading process also needs to account for the possibility that a predicted move may not occur, that an option may lose value, or that a position may be difficult to exit at the displayed price. A strong result from one trade cannot establish the reliability of a strategy across different market conditions.
Reviewing the Reported Profit and Loss
The position screenshot displays a net quantity of 3,175, a carry-forward average price of ₹4.50 and a P&L of ₹1,24,301.25. It also shows a net buy value of ₹14,287.50. The accompanying promotional copy rounds the initial capital to ₹14,300 and the profit to ₹1.25 lakh.
These figures provide the key reported performance details for the example. They should be read as the figures displayed in the supplied material, rather than as a promise of a repeatable return. The screenshot is a point-in-time position view and does not, by itself, confirm the final realised profit after the position is closed or all applicable costs are accounted for.
For transparency, Q7 should ensure that any published performance claim clearly distinguishes between displayed or unrealised P&L and realised profit, where applicable, and includes relevant risk disclosures.
Automation Does Not Remove Risk
The RBLBANK 400 PE example highlights the potential impact of a sharp market move on an options position. It also demonstrates why entry timing, position sizing and execution are important parts of any trading process.
Q7’s promotional material positions 2XALGO around automated trading opportunities in CE and PE instruments. However, no algorithm can guarantee profits or eliminate the possibility of losses. Options can be volatile, and capital can be lost, including in a short period. Past performance from an individual trade is not a reliable indicator of future results.
Before using any algorithmic trading tool, users should understand how the system operates, the risks involved, the applicable costs and the controls available for managing positions.
Conclusion: One Reported Trade, Not a Promise of Future Returns
The RBLBANK 400 PE trade shared by Q7 Trading Solutions highlights a reported move from an average entry price of ₹4.50 to a displayed price of ₹43.65. The supplied position screenshot shows P&L of ₹1,24,301.25, while the accompanying promotional material describes the result as approximately ₹1.25 lakh from around ₹14,300 in capital.
The example is presented as an illustration of Q7’s 2XALGO approach to algorithmic trading in suitable market conditions. Its figures should be considered in the context of this particular position, not as a guaranteed outcome or an assurance that similar trades will generate comparable returns.
Risk disclosure: Options and algorithmic trading involve substantial risk and may not be suitable for every investor. Losses can occur, and past performance does not guarantee future results. The figures in this article are based on the supplied trade material and may not reflect final realised returns after all costs. Readers should understand the risks and verify relevant details before making trading decisions.
Frequently Asked Questions
The supplied position screenshot shows a P&L of ₹1,24,301.25. The accompanying Q7 promotional content rounds this to approximately ₹1.25 lakh.
The supplied screenshot shows a carry-forward average price of ₹4.50.
The supplied position screenshot displays ₹43.65, with a price change of ₹2.20 (5.31%).
According to the supplied promotional material, Q7 2XALGO is an algorithmic trading tool designed to identify trading opportunities in Call Options (CE) and Put Options (PE), depending on market conditions.
No. Algorithmic trading does not guarantee profits or eliminate market risk. Options prices can move rapidly, and losses can occur.
The supplied screenshots document one reported trade example. They do not establish that the same result can be repeated or that future trades will generate similar returns.