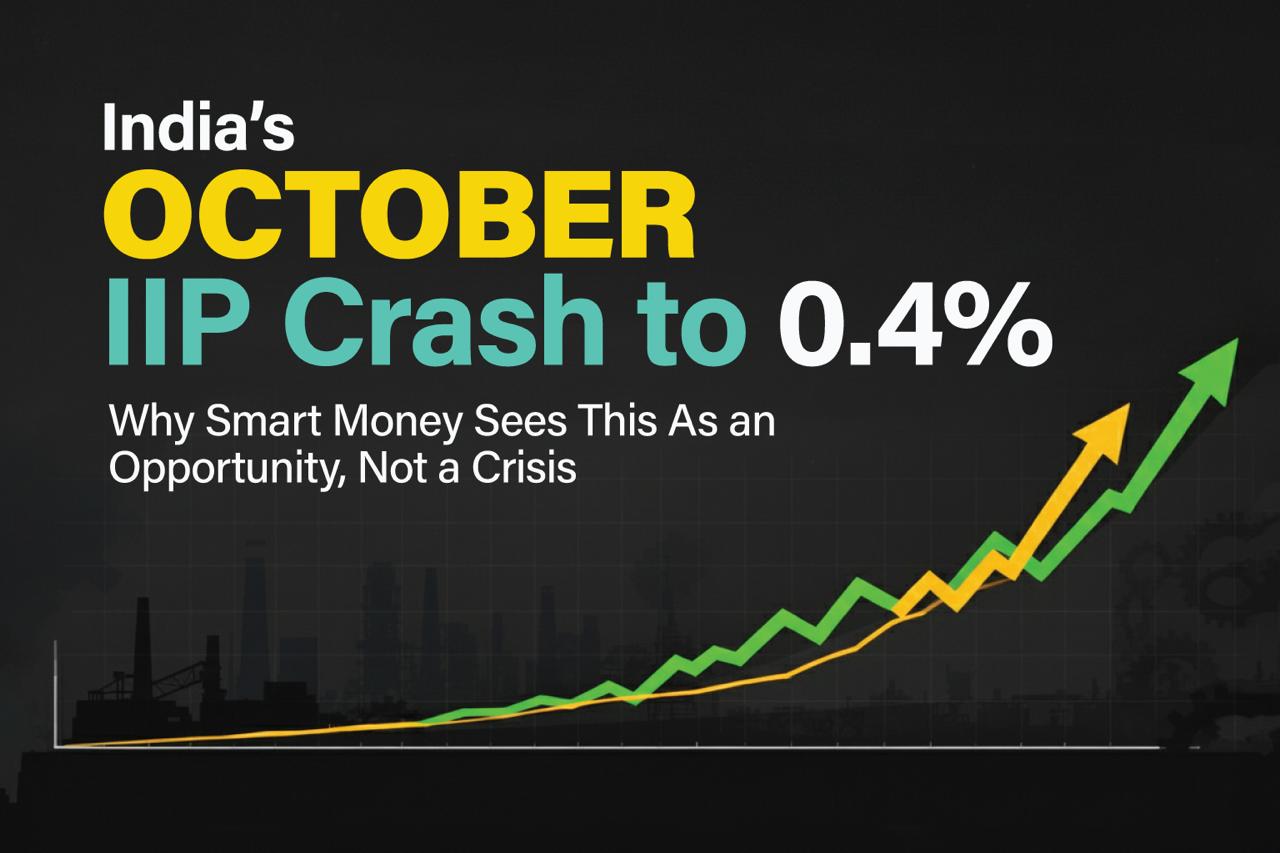
The Headline Everyone's Panicking About
When India’s industrial production growth fell to just 0.4% year-on-year in October 2025—down sharply from 4.6% in September and missing economist expectations of 3.1%—financial markets reacted with alarm. The headlines screamed “14-month low,” “production collapse,” and “growth warning signs.”
But here’s the problem with that narrative: it’s mathematically misleading.
Let me explain what’s actually happening in India’s factories, what the data really tells us, and why savvy traders and investors are already positioning for what comes next.
Table of Contents
- Chapter 1: The Math Behind the Panic: Understanding Base Effects
- Chapter 2: Manufacturing Isn't Crashing—It's Running Steady
- Chapter 3: The Consumption Boom Nobody's Talking About
- Chapter 4: The Infrastructure Engine: The Unsung Growth Story
- Chapter 5: Capacity Utilization: The "All-Clear" Signal Traders Are Watching
- Chapter 6: The Real Game-Changer: RBI's Rate Cut and Liquidity Surge
- Chapter 7: The Manufacturing PMI: A Contrarian Signal
- Chapter 8: What Smart Money Is Positioned For (Next 3 Months)
- Chapter 9: The Consumption Story: Still Intact
- Chapter 10: The Q3 FY26 Narrative Shift (January-February Outlook)
- Chapter 11: Key Takeaways: What This Means for You
- Chapter 12: Frequently Asked Questions
The Math Behind the Panic: Understanding Base Effects
To understand this story, you need to think about how year-on-year growth percentages work—and why they can deceive you when timing shifts.
The IIP Index Barely Moved
Here’s the critical insight that most media outlets are missing: The actual IIP index moved from 150.3 in October 2024 to 150.9 in October 2025.
That’s a +0.4% increase in absolute terms. Barely a blip.

But the year-on-year growth rate collapsed to 0.4% because October 2024 was an exceptionally strong month. Factories ramped up production ahead of Diwali, companies restocked inventories ahead of the festival rush, and consumer demand was booming post-pandemic. Against that elevated base, even healthy current production gets mathematically compressed into a tiny percentage.
This is the base effect trap.
The Calendar Distortion That Nobody’s Talking About
Here’s another crucial factor: Diwali timing shifted between the two years.
- October 2024: Diwali fell later in the month (November 1), allowing factories more working days for production scheduling
- October 2025: Diwali fell mid-month (October 29), compressing factory working days
This single shift—a calendar phenomenon completely unrelated to economic demand—artificially depressed production numbers. Economists at Bank of Baroda specifically flagged this: “Shifts in the festive calendar in 2025 vis-à-vis 2024 would make it prudent to assess the average for October and November together.”
Translation: Don’t read a single month when festival calendars shift. The real story emerges when you look at a two-month average.
Manufacturing Sector Isn’t Crashing—It’s Running Steady
Here’s where the narrative completely flips.
Within the headline 0.4% IIP growth, manufacturing sector showed 1.8% growth. That’s down from 5.6% in September, but still positive.
More importantly, nine of 23 industry groups recorded positive growth, with standout performers including:
- Basic Metals: +6.6%
- Motor Vehicles: +5.8%
- Coke & Refined Petroleum: +6.2%
- Capital Goods: +2.4% (consistently resilient)

This doesn’t look like an economy in crisis. It looks like selective strength within measured growth—exactly what you’d expect in an economy managing global tariff pressures while maintaining domestic momentum.
The sectors that contracted—consumer durables (-0.5%), consumer non-durables (-4.4%)—were adjusting inventory positions, not collapsing on demand destruction.
The Consumption Boom Nobody’s Talking About
Here’s what’s truly remarkable: While IIP stumbled, consumption indicators are firing on all cylinders.
India’s GST Collections Shatter Records
Gross GST collections of India in October 2025 hit ₹1,95,936 crore—a 4.6% year-on-year increase, and a direct reflection of real spending by Indian households and businesses.
Think about that for a moment. If production is collapsing, where is this spending coming from? The answer: It’s coming from inventory drawdowns.
Companies were sitting on excess inventory. When Indian government cut GST rates on September 22, 2025, firms had incentive to clear old stock to rebuild at lower cost. This inventory normalization temporarily depressed production numbers (the “IIP weakness”) while consumption remained strong (the “GST strength”).
Automobile Sales Hit Record Highs
The auto sector tells an even more dramatic story. October 2025 saw record passenger vehicle sales of 4.7 lakh units, a 17% jump from October 2024.
- Maruti Suzuki reported its best-ever monthly sales at 1,76,318 units, up 10.5% YoY
- Tata Motors hit 61,134 units (up 27%), with SUVs accounting for 77% of sales
- Mahindra & Mahindra recorded its highest-ever SUV sales at 71,624 units, up 31% YoY
This wasn’t just about the festive season. GST rate cuts made vehicles cheaper. Rural incomes improved after favorable monsoons. Consumer confidence remained high. This is real demand, not speculative hype.

Here’s the professional trader’s insight: When consumption is booming but IIP appears weak, it points to inventory normalization rather than demand destruction. Companies draw down excess stock ahead of rate changes, artificially depressing production. Once this inventory cycle completes, production rebounds sharply to match underlying consumption.
The Infrastructure Engine: The Unsung Growth Story
While media fixated on the IIP miss, something far more significant is reshaping India’s economy: record-breaking government capital expenditure.
The Capex Acceleration
The government allocated a record ₹11.21 lakh crore for capital expenditure in FY26—accounting for 3.1% of GDP, up from just ₹2 lakh crore in 2014-15.
For April-July FY26 (first four months), government capex stood at ₹3.5 lakh crore, up from ₹2.6 lakh crore in the same period last year. That’s 34.6% growth.
This capex-driven growth doesn’t appear cleanly in headline IIP data. It flows through metals, cement, and construction sectors, creating demand that emerges in consumption and services later. But the impact is undeniable:
Cement output: +5.3% in October
Steel output: +6.7% in October
Fertilizer production: +7.4% in October

This bifurcation is crucial: Old-economy IIP is flattish, but new-economy capex and services are booming.
Capacity Utilization: The “All-Clear” Signal Traders Are Watching
One metric that separates concerned economies from stable ones: manufacturing capacity utilization.
India’s capacity utilization in Q3 FY26 stood at 75.8%, up from 75.5% in Q2.
Why does this matter?
- Below 60%: Distress territory. Manufacturers close plants, cut jobs
- 60-70%: Concern zone. But manageable
- 70-80%: Healthy. Current position
- Above 80%: Capacity constraints. Triggers aggressive private investment

At 75.8%, Indian manufacturers aren’t in crisis. They’re running steady, maintaining employment, and positioned to ramp up when conditions improve. This is the profile of a sector managing a slowdown, not experiencing a collapse.
The Real Game-Changer: RBI’s Rate Cut and Liquidity Surge
Here’s what transforms the October IIP print from a “warning” into an “opportunity”: the RBI’s December 2025 policy response.
What Actually Happened in December
On December 12, 2025, the RBI’s Monetary Policy Committee unanimously cut the repo rate by 25 basis points to 5.25% (down from 5.50%).
More significantly, the RBI injected ₹1.4 trillion into the system through:
- ₹1 trillion in OMO purchases of government bonds
- ₹5 billion foreign exchange buy/sell swap for 3 years
This is the liquidity support that professional traders live for.
Why This Matters for Markets
Markets love liquidity more than they love growth.
When weak growth data prompts central banks to ease, a predictable pattern emerges:
- Week 1-2: Panic selling by retail investors. Smart money accumulates.
- Week 3-4: Policymakers deliver dovish guidance. Narrative shifts from “crisis” to “support incoming.”
- Month 2-3: Rate cuts flow through the system. Liquidity drives rally, especially in:
- PSU stocks (government-linked companies benefit from easing)
- Infrastructure plays (benefit from capex acceleration and lower borrowing costs)
- Metals (demand from capex, support from liquidity)
- Small & midcap stocks (liquidity-driven rebounds)
Historical precedent: Periods of monetary easing following weak data typically generate 1-3 months of sustained equity rallies, with particularly strong performance in cyclical sectors.
The Manufacturing PMI: A Contrarian Signal
While IIP disappointed, the HSBC India Manufacturing PMI surged to 59.2 in October from 57.7 in September—marking the fastest expansion in five years.
PMI’s message: Manufacturing sentiment is improving, not deteriorating.
This discrepancy—weak IIP, strong PMI—further confirms the narrative: The IIP miss is temporary and calendar-driven, while underlying business conditions are strengthening.
What Smart Money Is Positioned For (Next 3 Months)
Based on historical patterns when weak data prompts monetary easing:
Immediate (Week 1-2)
- Market volatility as retail investors panic-sell
- Smart money accumulation in quality PSU and infrastructure stocks
- Bonds rallying on rate-cut expectations
Near-term (Week 3-4)
- RBI’s dovish guidance reframes narrative
- Cyclical sectors (metals, infrastructure, PSUs) start outperforming
- Small & midcaps experience short-covering rallies
Medium-term (Month 2-3)
- Strong consumption data and government spending become the story
- November-December IIP numbers expected to rebound (inventory rebuilds)
- Sectoral rotation toward those that benefit most from lower rates:
- PSU banks (lending growth, margin recovery)
- Infrastructure (lower capex costs, government acceleration)
- Basic materials (capex-driven demand)
- Mid-cap cyclicals (leverage effect of lower rates)
The Consumption Story: Still Intact
Let’s be clear about what October’s data actually shows about consumer demand:
Rural Recovery: Favorable monsoons improved agricultural income. India’s November GST collections came in at ₹1,70,276 crore, slightly down from October but still respectable, suggesting rural purchasing power remains firm.[attached_file:1]
Urban Spending: GST rate cuts (September 22 benefit fully realized in October) provided price relief. Lower interest rates (RBI cuts) improve affordability for loans and EMIs. Real purchasing power is expanding, not contracting.
Income Support: Income tax reforms announced in 2025 put additional rupees in household pockets. Government salary payments remain robust.
Verdict: Consumption demand remains strong. The IIP weakness reflects production timing, not demand destruction.
The Q3 FY26 Narrative Shift (January-February Outlook)
By January-February 2026, here’s what we expect:
- Stronger IIP numbers: November-December readings rebound as inventory rebuilds normalize
- Continued strong GST: Consumption trajectory remains upward
- Robust government spending: Capex flows through the system
- Services exports: Continue double-digit growth
- RBI potentially cutting again: February 2026 policy meeting could deliver another 25-50 bps cut
The October IIP number won’t be remembered as a crisis warning. It will be remembered as the dip before a bounce.
This is why institutional investors viewed the October weakness as an entry point, not an exit opportunity.
Key Takeaways: What This Means for You
- The IIP headline is misleading. Yes, growth fell to 0.4%, but the actual index barely moved (150.3 to 150.9). Base effects and calendar shifts explain the story.
- Consumption remains strong. GST collections, auto sales October 2025, and PMI all confirm healthy demand. The weak IIP reflects inventory cycles, not demand collapse.
- India’s Capacity utilization is healthy. At 75.8%, Indian factories aren’t in distress. They’re positioned for rebounds.
- Government capex is accelerating. Record infrastructure spending (up 34.6% to ₹3.5 lakh crore) will drive long-term growth and create demand that emerges in coming quarters.
- RBI’s liquidity injection is significant. The December rate cut by RBI and ₹1.4 trillion liquidity support set up a likely 3-month rally in cyclical and infrastructure stocks.
- Don’t read one month in isolation. Seasonal factors, festival timing, and inventory cycles matter. Look at trends, not snapshots.
Bottom line: The October IIP weakness is real, but it’s a timing issue, not a demand issue. Smart money recognized this immediately and is already positioned for the bounce. By Q4 FY26, this October number will be seen as a temporary blip in a broader growth story underpinned by strong consumption, accelerating capex, and RBI support.
Frequently Asked Questions
The year-on-year growth rate fell sharply, but the actual IIP index barely moved (150.3 → 150.9). The collapse in growth percentages is primarily due to an exceptionally strong October 2024 base, combined with fewer working days in October 2025 due to Diwali timing. Bank of Baroda economists recommend assessing October and November together to avoid distortions.
This pattern points to inventory normalization, not demand destruction. Companies held excess inventory and drew it down (depressing production) ahead of GST rate cuts in late September, while consumers continued spending normally (maintaining GST collections). Once inventory cycles normalize, production rebounds to match underlying consumption.
The RBI cut the repo rate by 25 bps to 5.25% and injected ₹1.4 trillion into the banking system. Historically, monetary easing following weak data triggers 1-3 months of equity rallies, particularly in cyclical sectors like PSUs, infrastructure, and metals. This sets up a favorable environment for December 2025-February 2026.
Yes. Government capex (₹3.5 lakh crore April-July, up 34.6% YoY) doesn’t flow directly into headline IIP—it takes time to translate into consumer-facing production. But it creates demand in metals, cement, and construction that drives future growth. This capex cycle underpins long-term momentum.
November and December 2025 IIP numbers are expected to rebound as inventory restocking normalizes and the calendar base becomes less distorted. By January 2026, quarterly data will show the October print as a temporary dip within a broader growth trend.
No. Manufacturing showed 1.8% growth in October, capacity utilization is at a healthy 75.8%, and the HSBC PMI (59.2) indicates improving conditions. Nine of 23 industry groups showed positive growth. This isn’t distress—it’s a normal slowdown within an intact economic cycle.
Data Sources & Methodological Notes
This analysis draws from:
- Ministry of Statistics and Programme Implementation (MOSPI): October 2025 IIP Quick Estimates[web:112]
- RBI Monetary Policy Committee: December 2025 policy decision[web:118][web:119]
- Goods and Services Tax Network: October 2025 GST collections[web:114]
- Society of Indian Automobile Manufacturers & Auto Industry Data: October 2025 auto sales[web:126]
- HSBC India Manufacturing PMI: October 2025 sentiment indicator[web:112]
- Bank of Baroda Economics Research: IIP analysis and capex assessments
- Trading Economics & CEIC: Capacity utilization data[web:124]
Data Quality Notes:
- IIP figures are subject to revision (Quick Estimates vs Final Estimates)
- GST data reflects gross collections; net GST excludes refunds
- Auto sales data from industry body estimates; final SIAM data may vary slightly
- Capacity utilization is quarterly; Q3 data covers July-September quarter average
Limitations:
- Single-month IIP figures can be distorted by seasonal, calendar, and one-off factors
- PMI is a sentiment measure, not actual production volume
- October being a festival month introduces structural volatility